Impacts of an Increased Substitution of Fossil Energy Carriers with Electricity-Based Technologies on the Swiss Electricty System
Electrifying the energy system with heat pumps (HP) and battery electric vehicles (BEV) is a strategy of Switzerland and many other countries to reduce CO2 emissions. A large electrification, however, poses several new challenges for the electricity system, particularly in combination with a simultaneous substitution of nuclear power plants (NPP) by volatile renewables such as photovoltaics (PV).
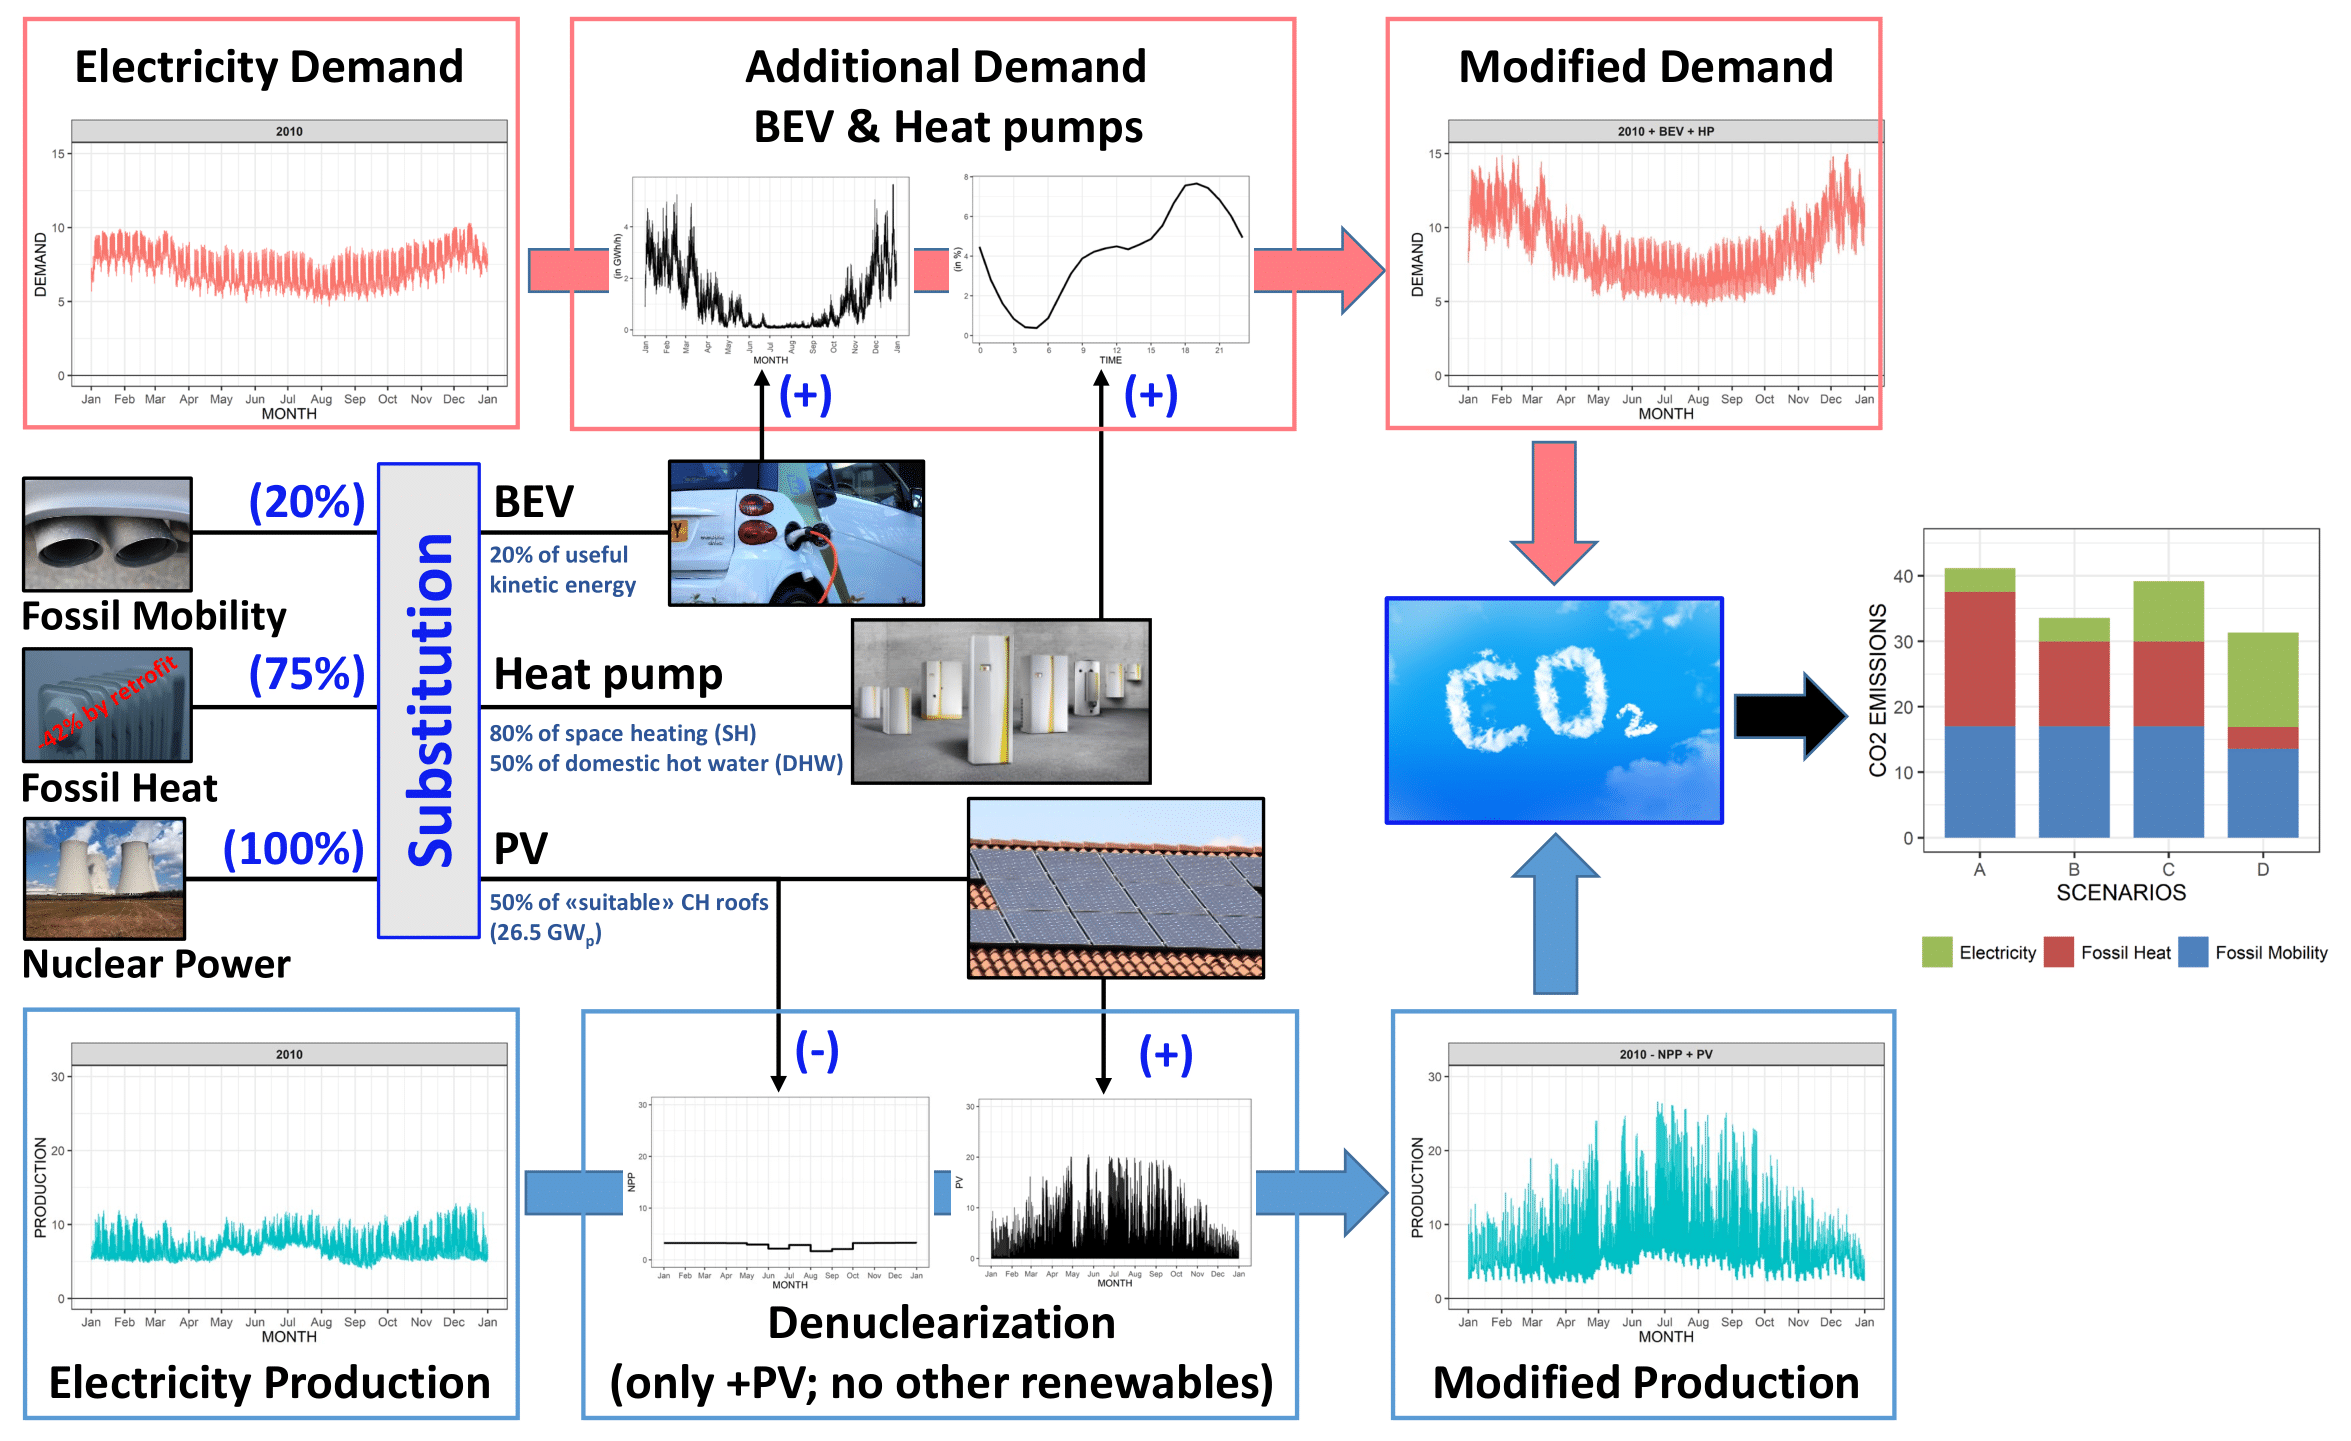
In this study, these challenges in terms of additional electricity demands, deficits and surpluses as well as effective CO2 mitigation are assessed in a dynamic and data-driven approach (see Fig. 1). With this approach, there is no more need for predictions or forecasts on the evolution of the future energy system. This offers the benefit that large uncertainties and ambiguities such as on population growth, GDP growth, penetration of new technologies, social and behavioral changes, etc., do not need to be taken into account explicitly. In turn, the energy system is taken as it is and strategic measures (of the Swiss Energy Strategy (ES2050) [1]) are added or subtracted based on actual measurements and data of the electricity, heat and mobility sectors along with meteorological data and state-of-the-art specifications on the employed technologies (e.g., HP, BEV, etc.).
The additional electricity demand of HP is estimated from hourly measured heat demand profiles of a Swiss district heating provider. This heat demand is subsequently disaggregated into space heating (SH) and domestic hot water (DHW) demand. For SH, an overall reduction of 42% according to the most conservative scenario "Business As Usual" (BAU) of the ES2050 is assumed and implemented by means of the “Combined Energy Simulation and Retrofitting“ (CESAR) model [2]. For the electricity demand of BEV, different recharging patterns (e.g., at home, at work, etc.) are used. Both for heating and mobility, no load shifting strategies are implemented.
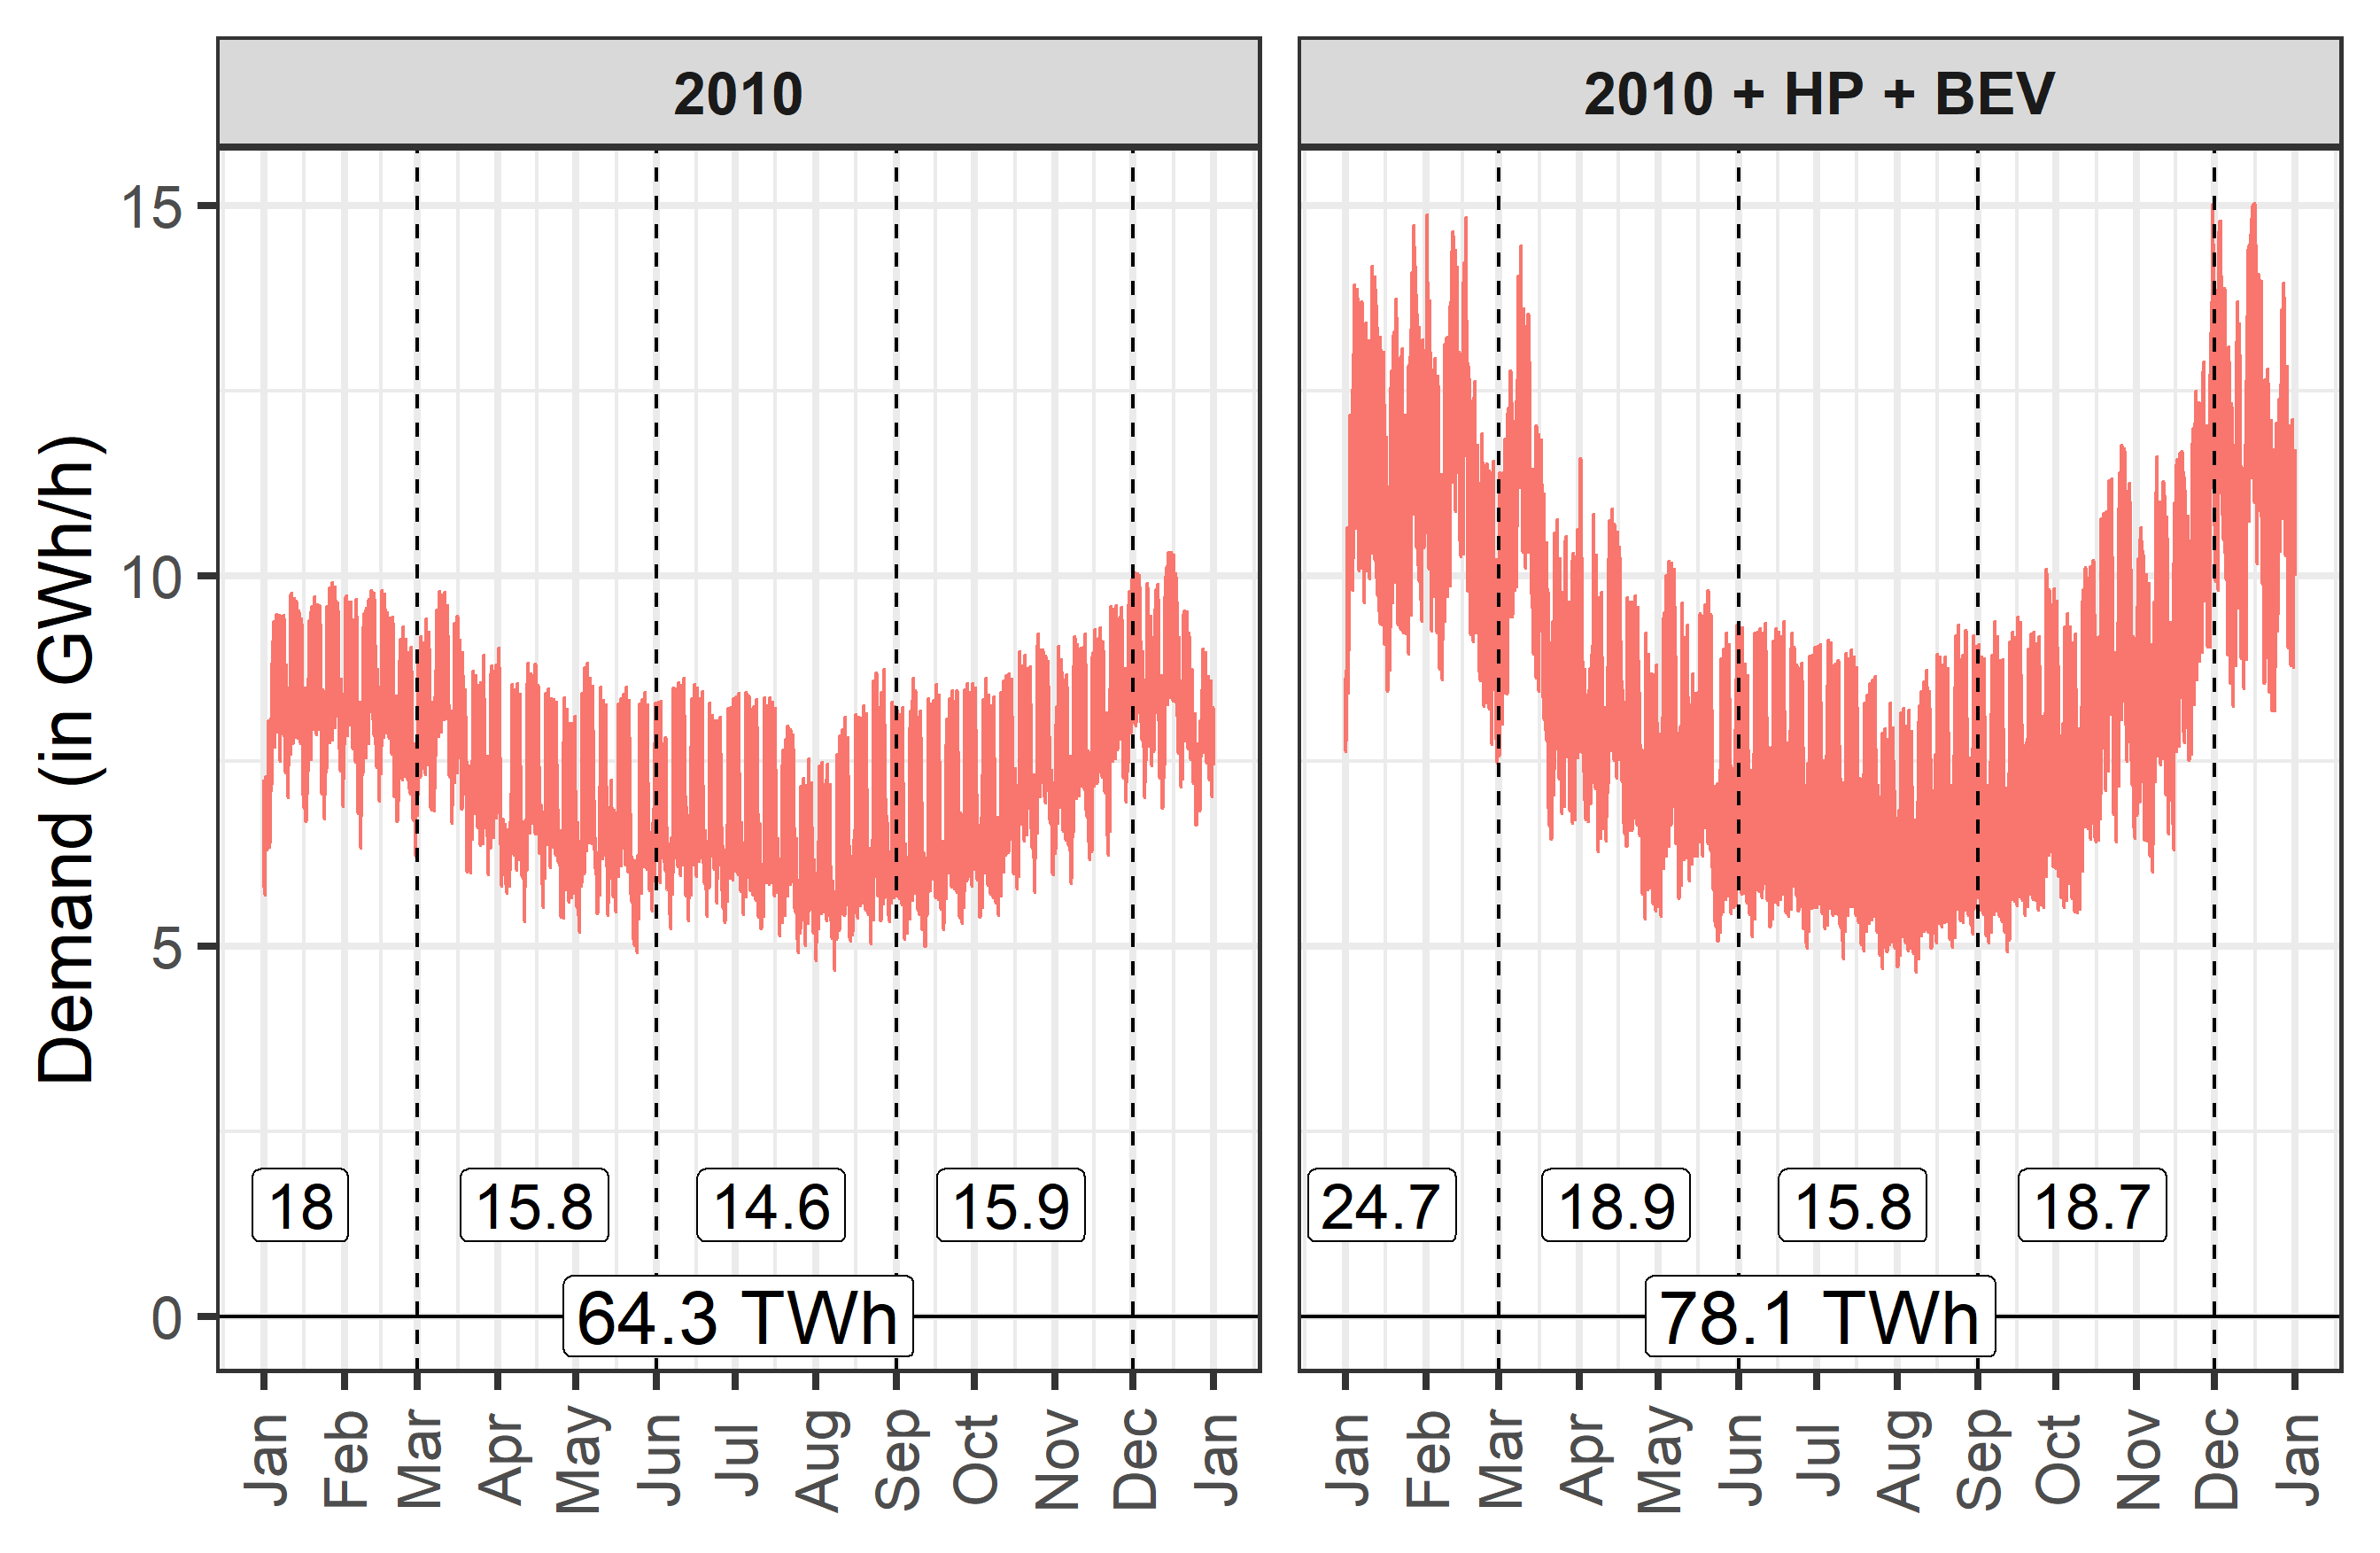
Fig. 2 shows that with a HP and BEV penetration of 75% and 20%, respectively, there is an almost 25% (13.7 TWh/year) increase of the electricity demand and – just as challenging – an additional maximum power requirement of 5.9 GWh/h (hourly-averaged power). This is an increase compared to the current peak power demand of about 10 GWh/h by a factor of almost 1.5.
On the electricity production side, NPP are deducted from the current electricity production profile, while PV is added at an hourly resolution (see Fig. 3). Currently, on average, about 25 TWh are annually produced by the five NPP in Switzerland. In the GIS project “sonnendach.ch”, it is estimated that about 68% of all Swiss roofs are “suitable” for PV with a total (technical) potential of about 50 TWh per year (not considering façades, etc.). If all NPP electricity is replaced by PV – which is currently the most likely scenario in Switzerland – about 50% of these “suitable” roofs must be equipped with PV panels. Other renewable energy technologies such as wind, biomass, and geothermal are not considered as they most likely only play a minor role in Switzerland in the short- and medium-term future.
Although the total electricity production remains equal, the seasonal production shows that in the modified profile about 5 TWh are shifted from winter to summer. In the modified profile, electricity production peaks in summer rise to 26.6 GWh/h, compared to 12.9 GWh/h in the original profile.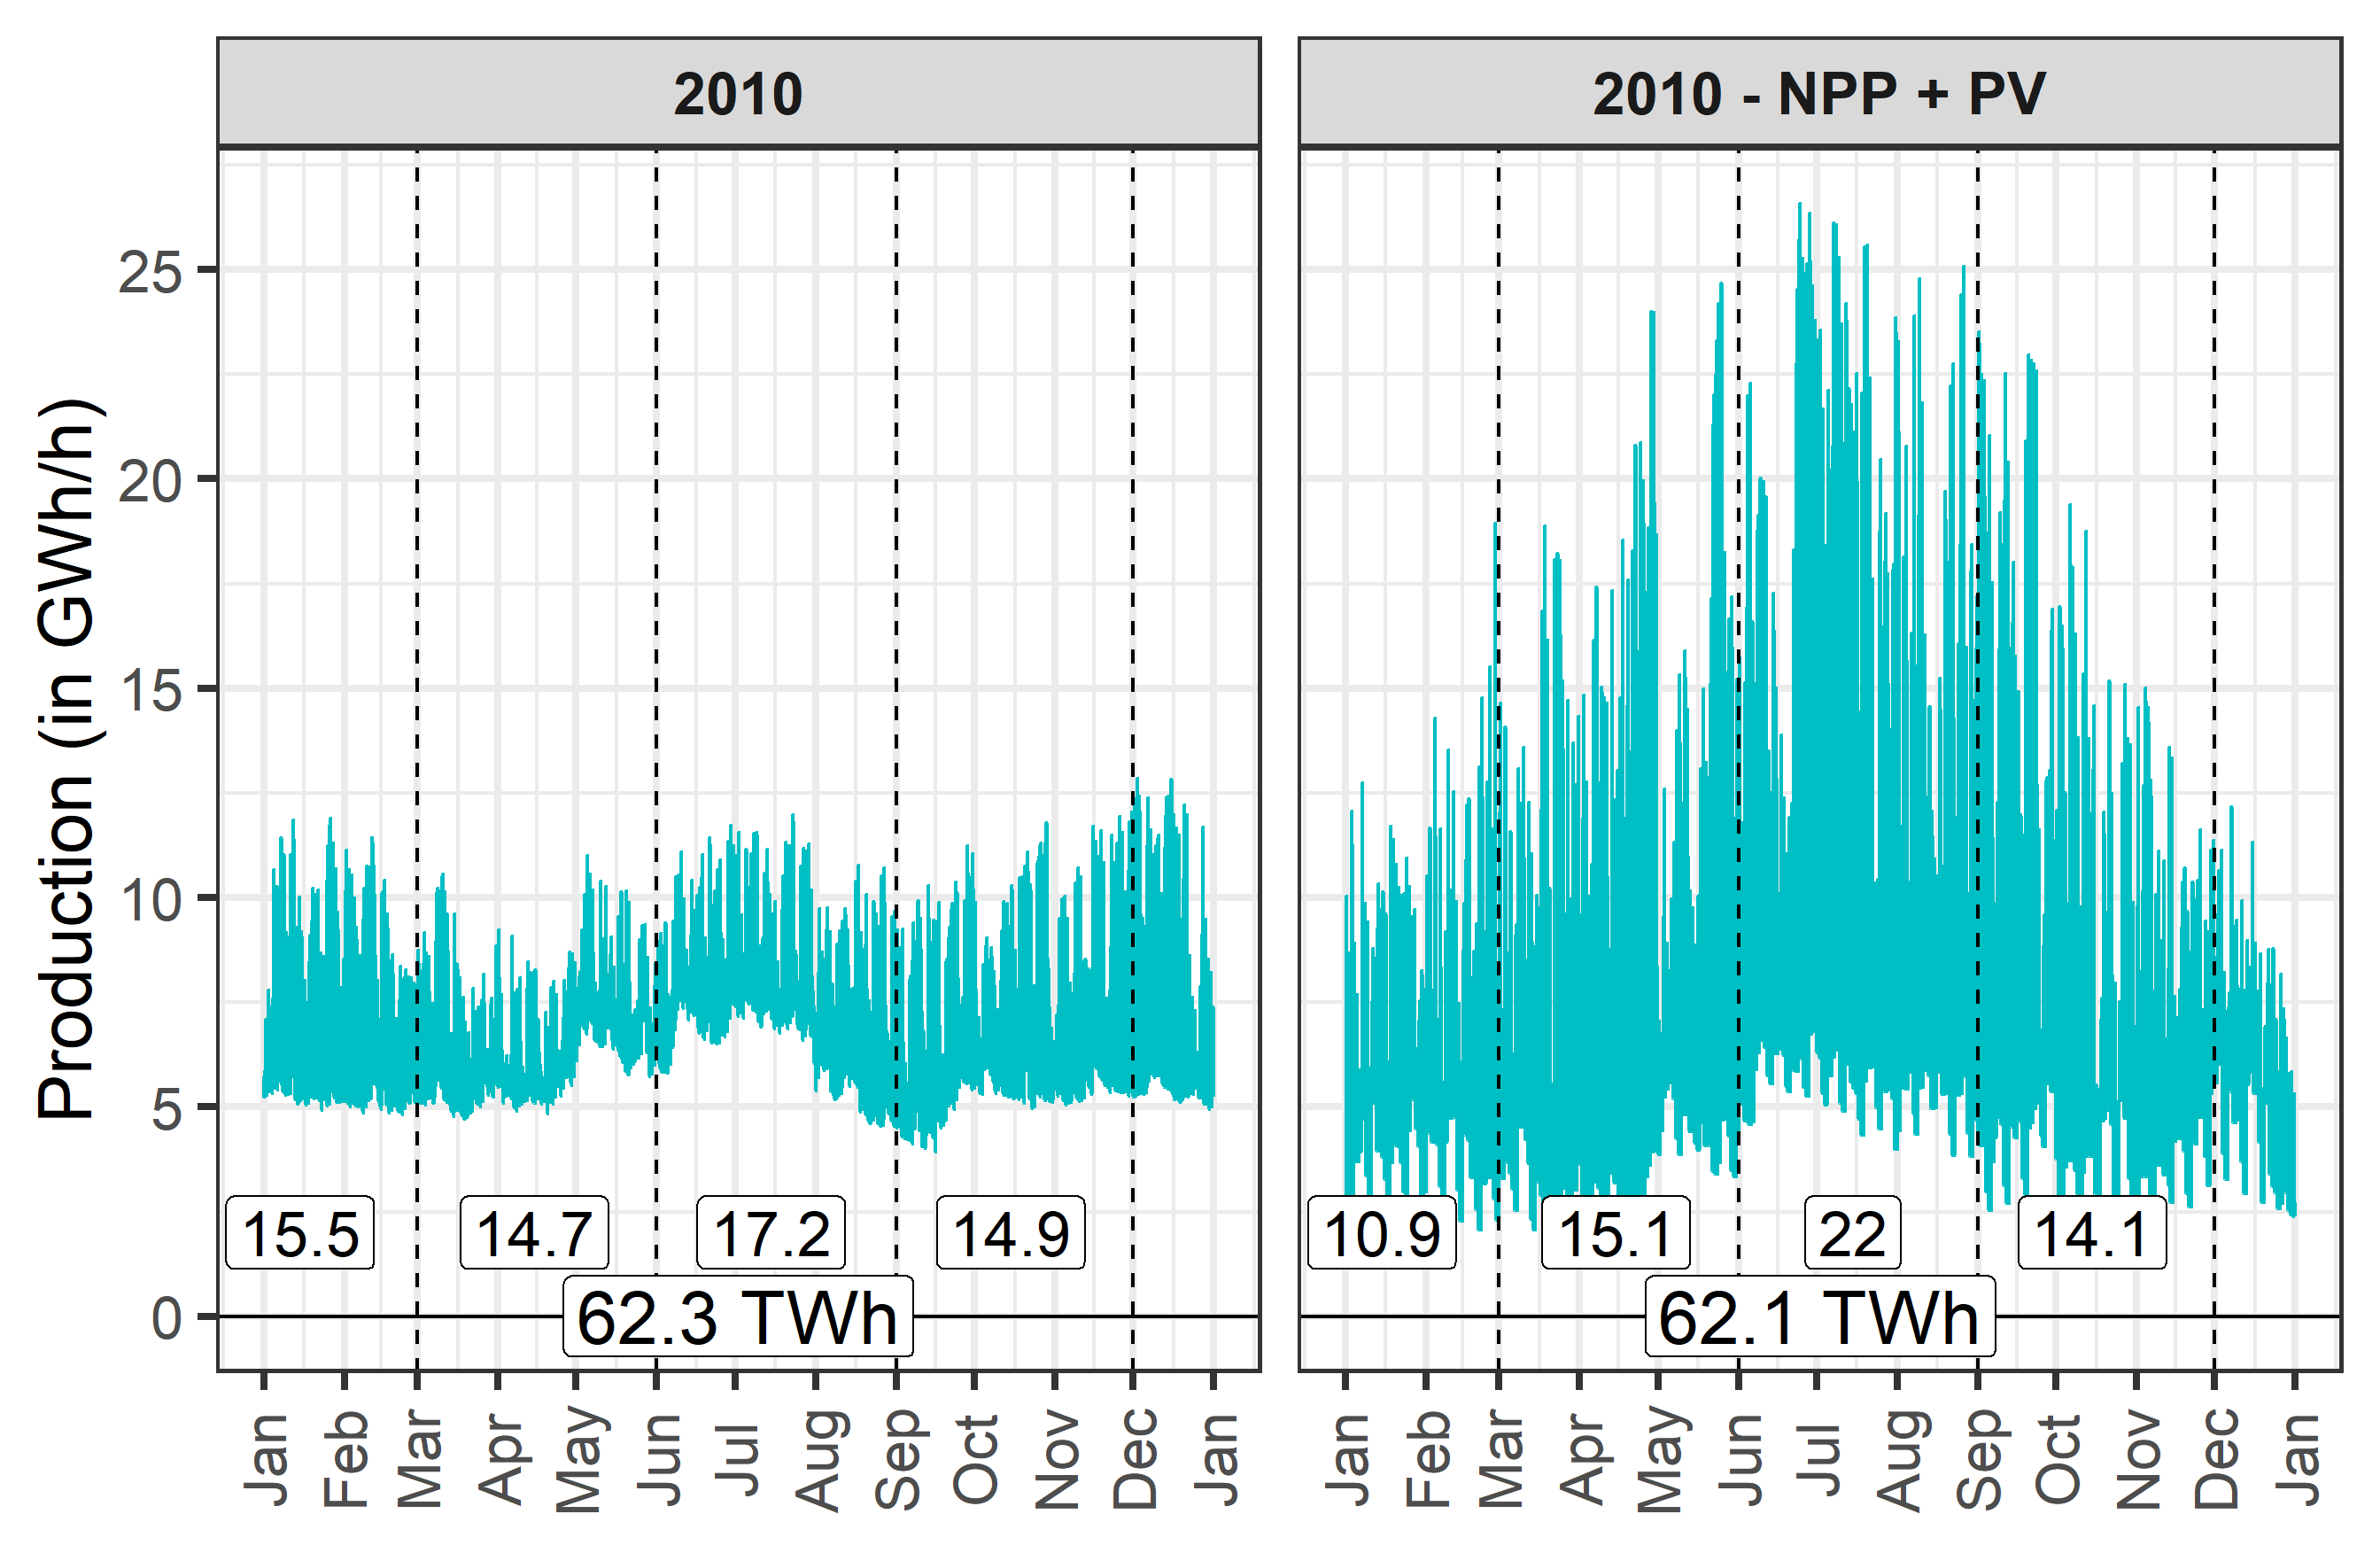
Based on the original and modified electricity demand and production profiles in Fig. 2 and 3, three scenarios are defined:
● "Status quo": Electricity demand and production of Swissgrid for 2010 (Left figures in Fig. 2 and 3).
● "PV-NPP": Electricity demand of Swissgrid for 2010 (Fig. 2, left) and modified electricity production (Fig. 3, right)
● "PV-NPP-HP-BEV": Modified electricity demand and production (Right figures in Fig. 2 and 3).
Momentary (hourly) electricity surpluses and deficits for the three scenarios “Status quo”, “PV-NPP” and “PV-NPP-HP-BEV” are plotted in Fig. 4 along with their seasonal and annual sums.
Without additional storage, large amounts of electricity must be imported in winter and at night, while in summer at noon there is a large surplus from PV. By means of short-term storage with pumped-hydro storage (PHS) and stationary batteries, annual deficits can be reduced to 24.1 TWh and annual surpluses to 7.5 TWh. With seasonal electricity storage, surpluses could be eliminated completely, while deficits would remain at 15.9 TWh, which is the absolute difference of the annual electricity consumption and production in “PV-NPP-HP-BEV”. In order to further reduce deficits (in winter) – at a given heat and mobility demand – also thermal storage, sector coupling (e.g., power-to-gas) and demand/supply side management, etc., have to be considered. Thermal storage could for instance be to seasonally store excess heat and electricity in summer (e.g., in the soil) and retrieving it in winter (e.g., by means of ground-source heat pumps) to cover at least some of the heat demand in winter.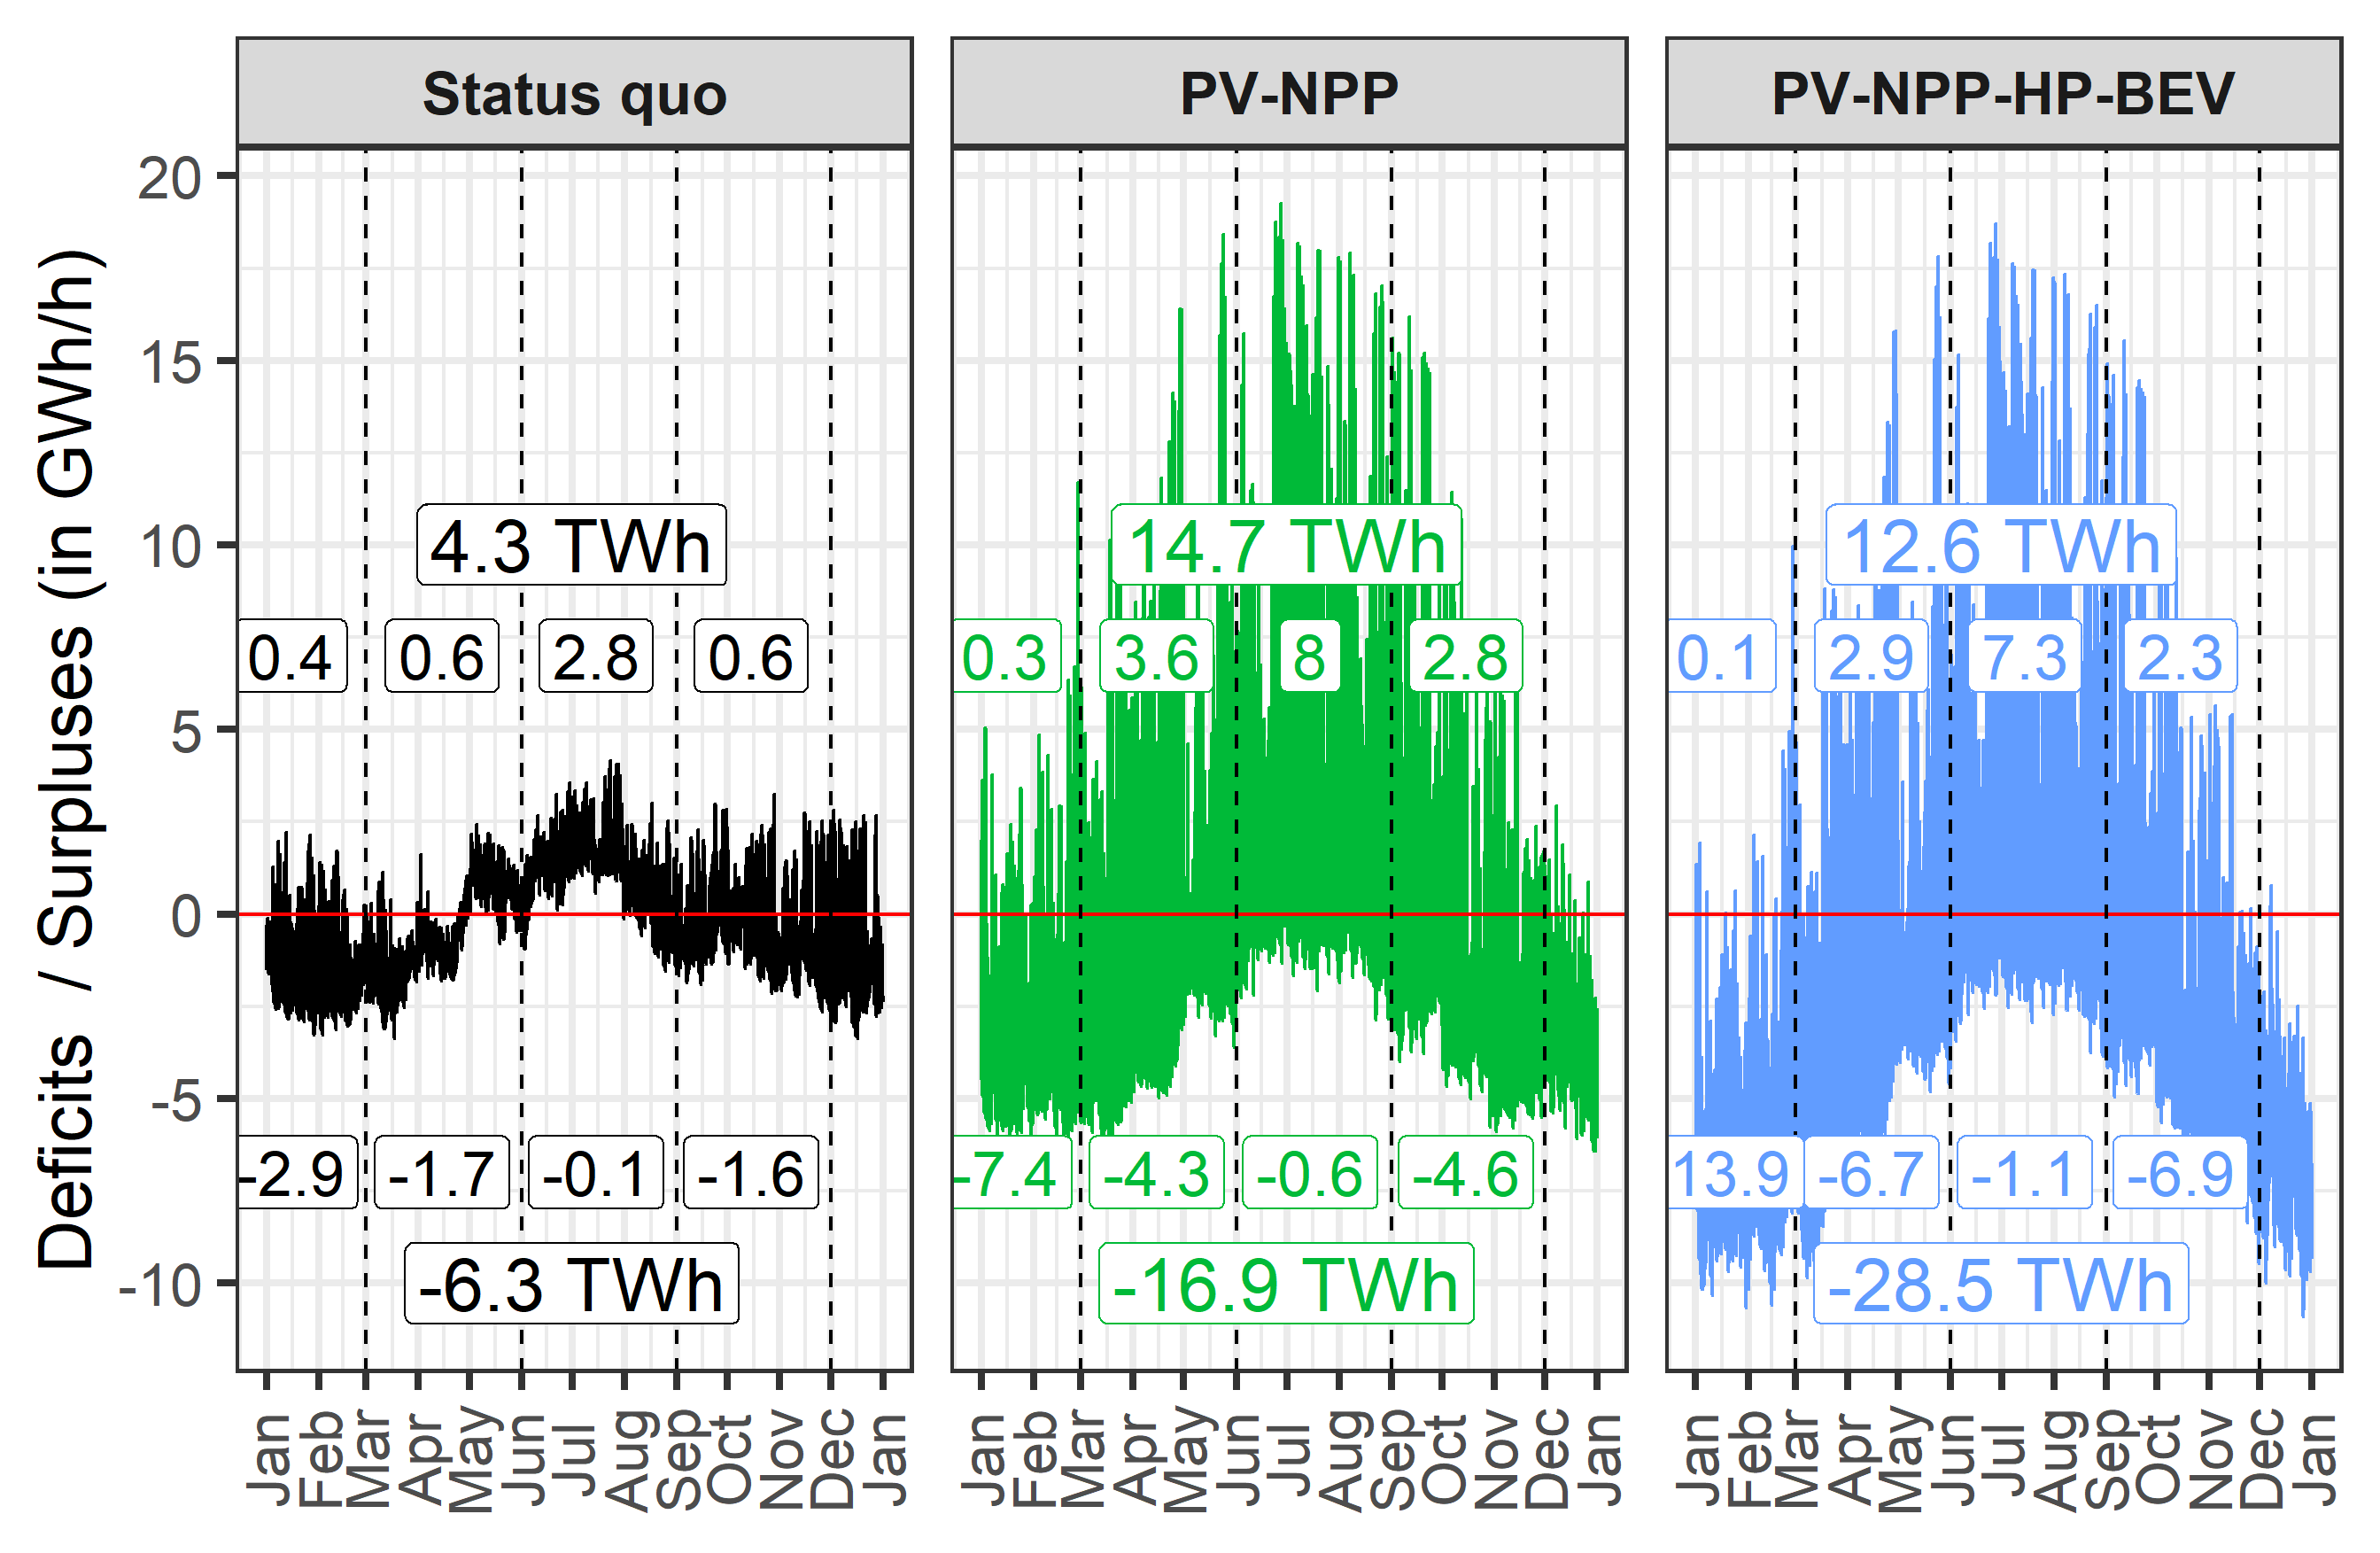
In order to estimate CO2 emissions, life-cycle analysis (LCA) CO2 intensities of the different technologies are used. In Fig. 5, the hourly CO2 intensities of the used electricity in the “Status quo” (left) and the scenarios “PV-NPP” and “PV-NPP-HP-BEV” (center and right) are plotted. Additionally, the demand-weighted averages for all seasons and the full year are plotted.
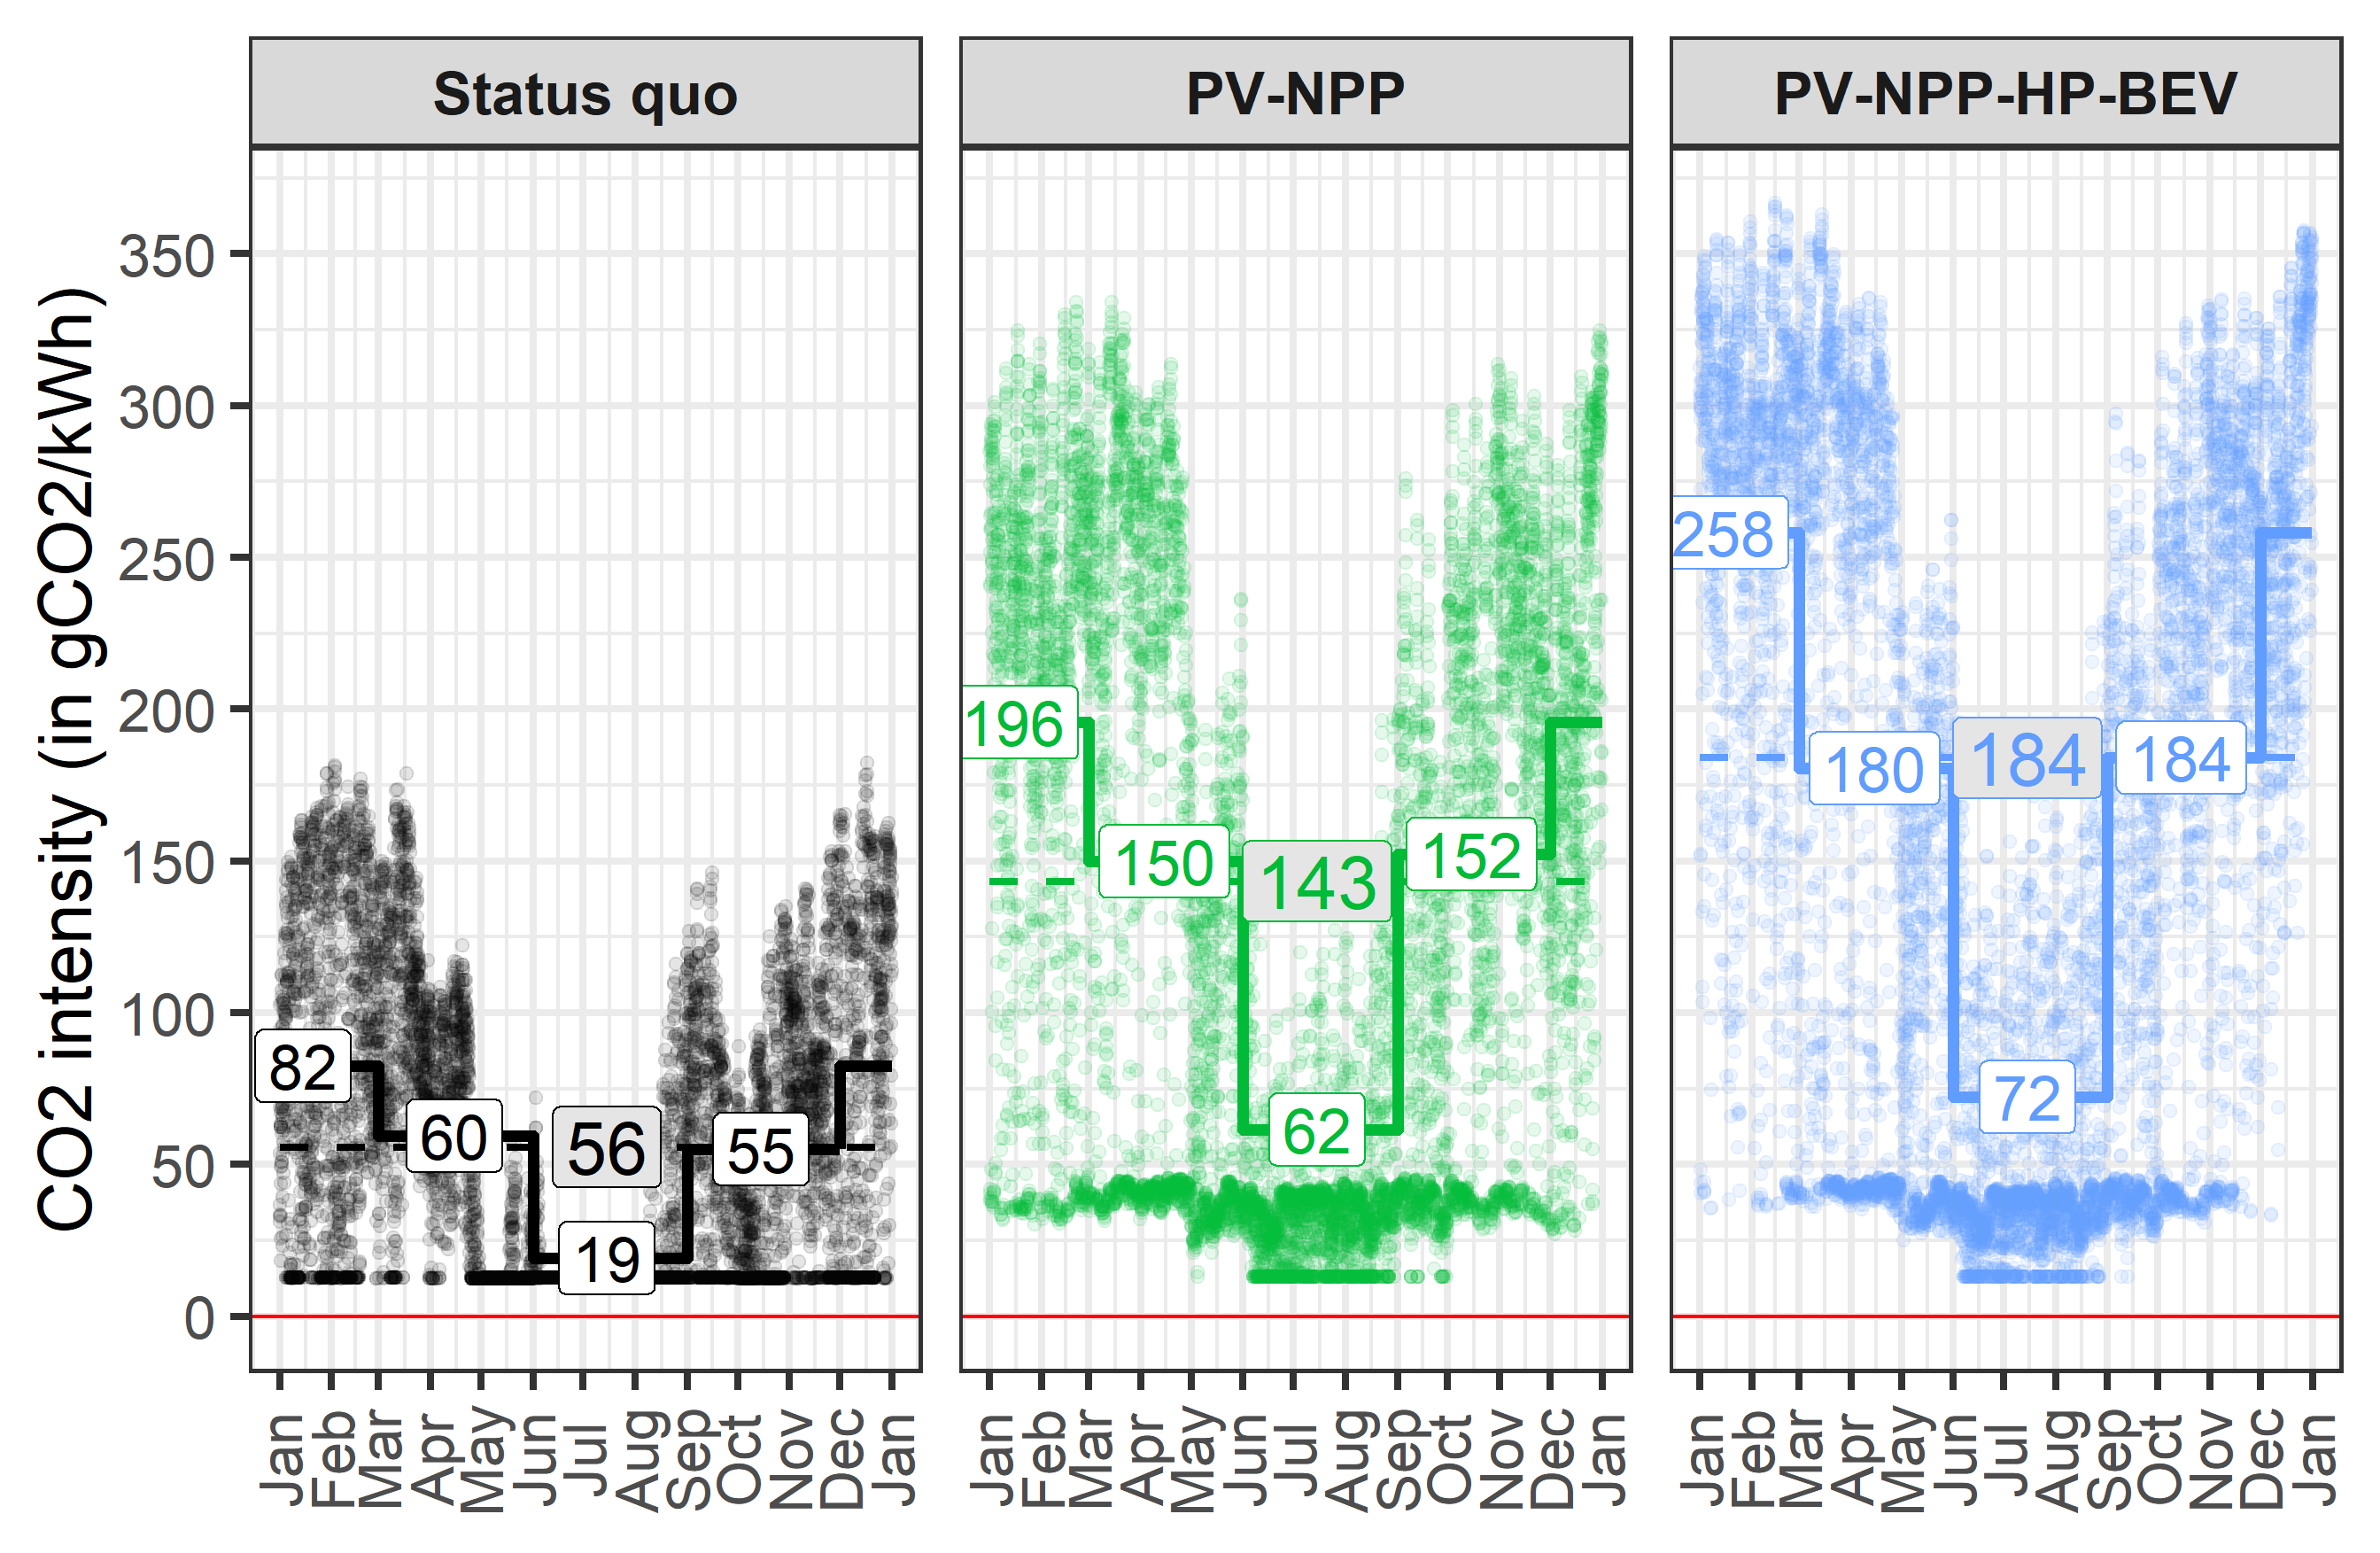
Due to their high CO2 intensities – at least for the next decades – electricity imports and PV may – depending on the reference scenario (with or without NPP) and assumptions on other key parameters – even offset the overall CO2 savings of a highly electrified Swiss energy system.
In conclusion, these results show that an electrification cannot be the sole solution of an energy transition to less CO2. Nonetheless, the electrification of heat and mobility will play an important role in the future energy system, not least for reasons other than CO2 reduction (e.g., local air pollution and noise mitigation, etc.). It seems important that the expansion of renewable sources, be it electricity or other sources of energy, is matched to the additional consumption of the respective energy sources in a timely and quantitative manner.
References
[1] Prognos. Die Energieperspektiven für die Schweiz bis 2050. Energienachgefrage und Elektrizitätsangebot in der Schweiz 2000–2050; Technical Report; Prognos AG: Basel, Switzerland, 2012.
[2] Wang, D.; Landolt, J.; Mavromatidis, G.; Orehounig, K.; Carmeliet, J. CESAR: A bottom-up building stock modelling tool for Switzerland to address sustainable energy transformation strategies. Energy Build. 2018, 169, 9–26.
Martin Rüdisüli, Sinan L. Teske, Urs Elber
Impacts of an Increased Substitution of Fossil Energy Carriers with Electricity-Based Technologies on the Swiss Electricity System; Energies (2019);
Download: doi: 10.3390/en12122399
Related Assets
-
Share
